Sound Transit's Office of Civil Rights, Equity and Inclusion believes in leveling the playing field for all qualified consultants and contractors. It is our mission to help develop emerging and established Disadvantaged Business Enterprises (DBEs) and small businesses (SBs) so they can successfully compete on Sound Transit contracts. The agency's 25-year capital expansion program and state of good repair projects means the time to build DBE/SB capacity is now.
You can find Sound Transit's DBE historical data, dating back to 2020, below.
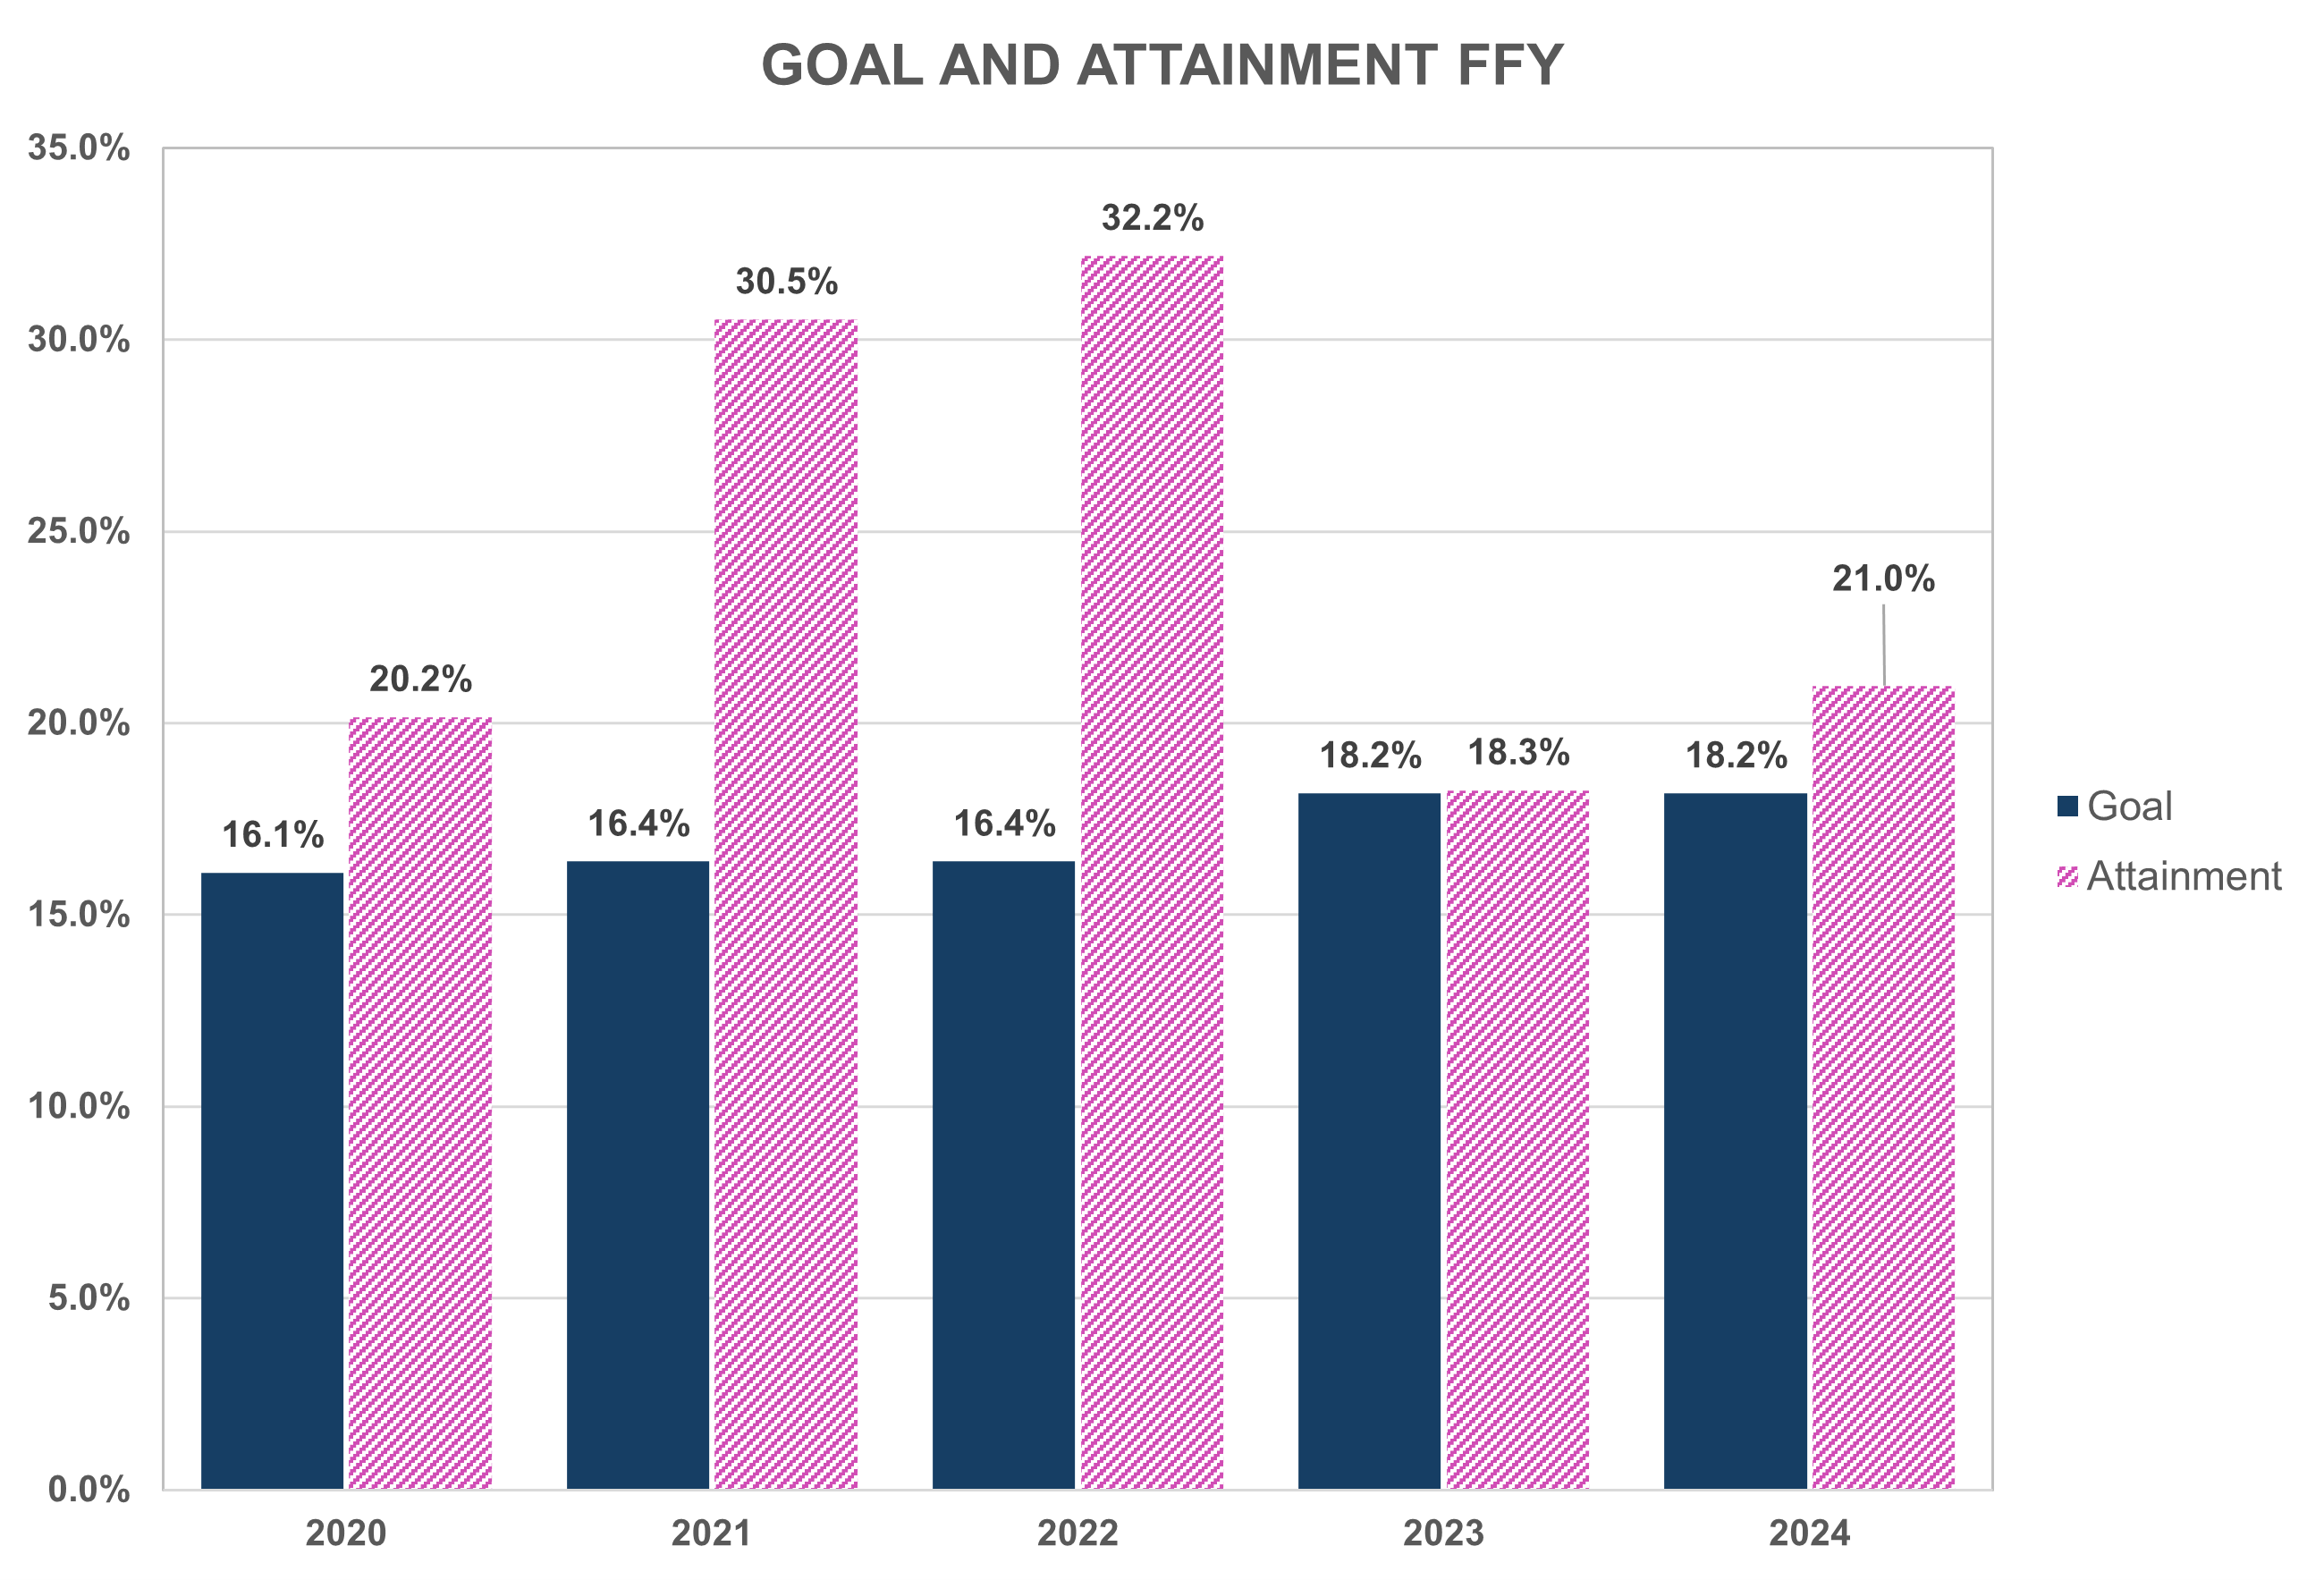
Goal and Attainment by FFY
| FFY | Goal | Attainment |
| 2020 | 16.1% | 20.2% |
| 2021 | 16.4% | 30.5% |
| 2022 | 16.4% | 32.2% |
| 2023 | 18.2% | 18.3% |
| 2024 | 18.2% | 21.0% |
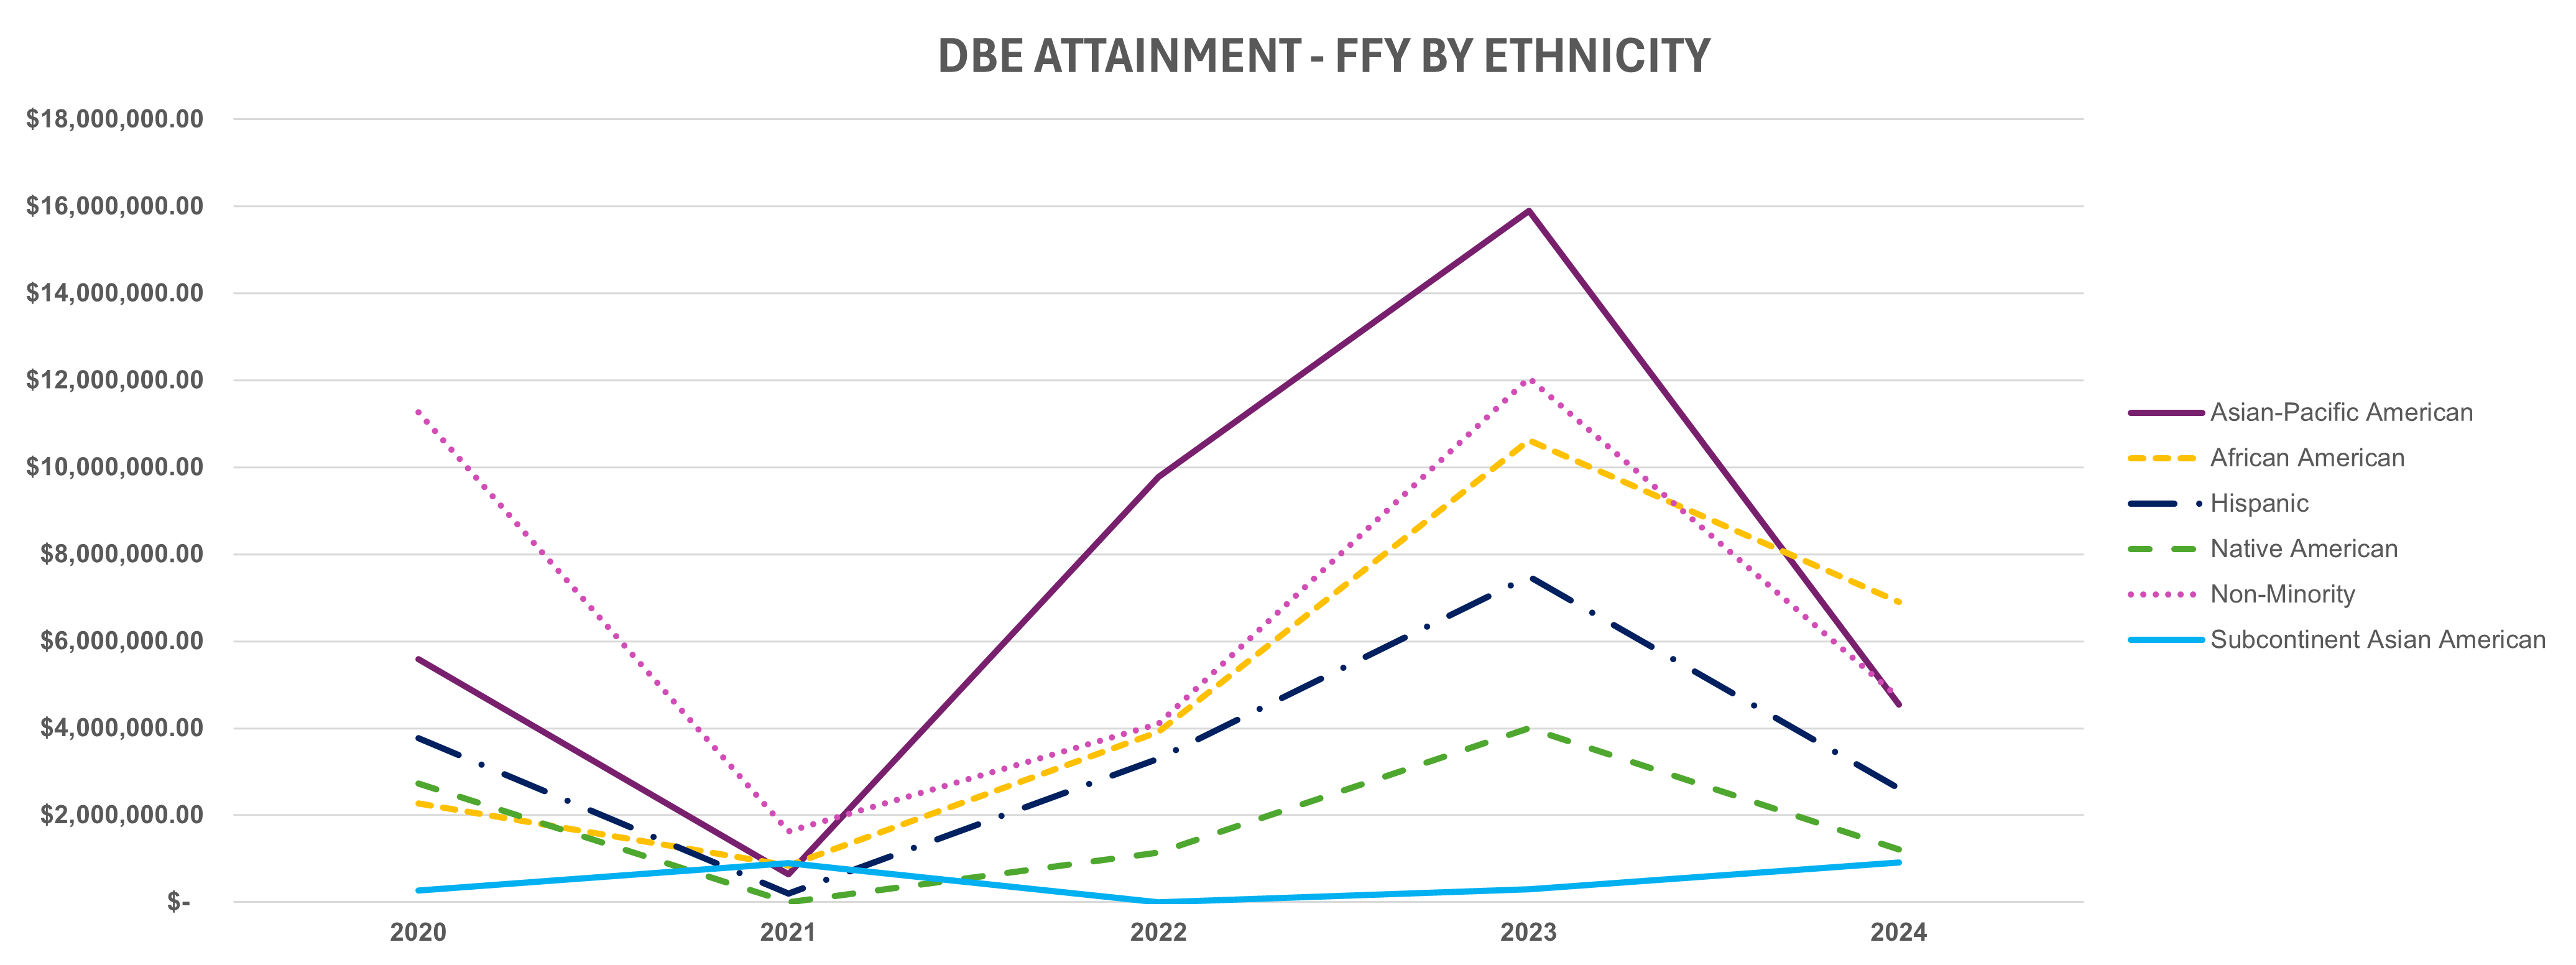
DBE Attainment - FFY by ethnicity
| FFY | Asian-Pacific American | African American | Hispanic | Native American | Non-Minority | Subcontinent Asian American | FFY total |
| 2020 | $5,589,796 | $2,265,283 | $3,774,270 | $2,728,609. | $11,267,729 | $271,000. | $25,896,687 |
| 2021 | $636,897 | $842,195 | $203,917 | $0 | $1,630,673 | $891,238. | $4,204,920 |
| 2022 | $9,778,085 | $3,916,208 | $3,302,332 | $1,134,197 | $4,100,369 | $0 | $22,231,191 |
| 2023 | $15,902,818 | $10,626,682 | $7,485,772 | $4,005,089 | $12,045,147 | $298,567 | $50,364,075 |
| 2024 | $4,549,708 | $6,899,085 | $2,612,388 | $1,209,144 | $4,707,427 | $918,236 | $20,895,990 |
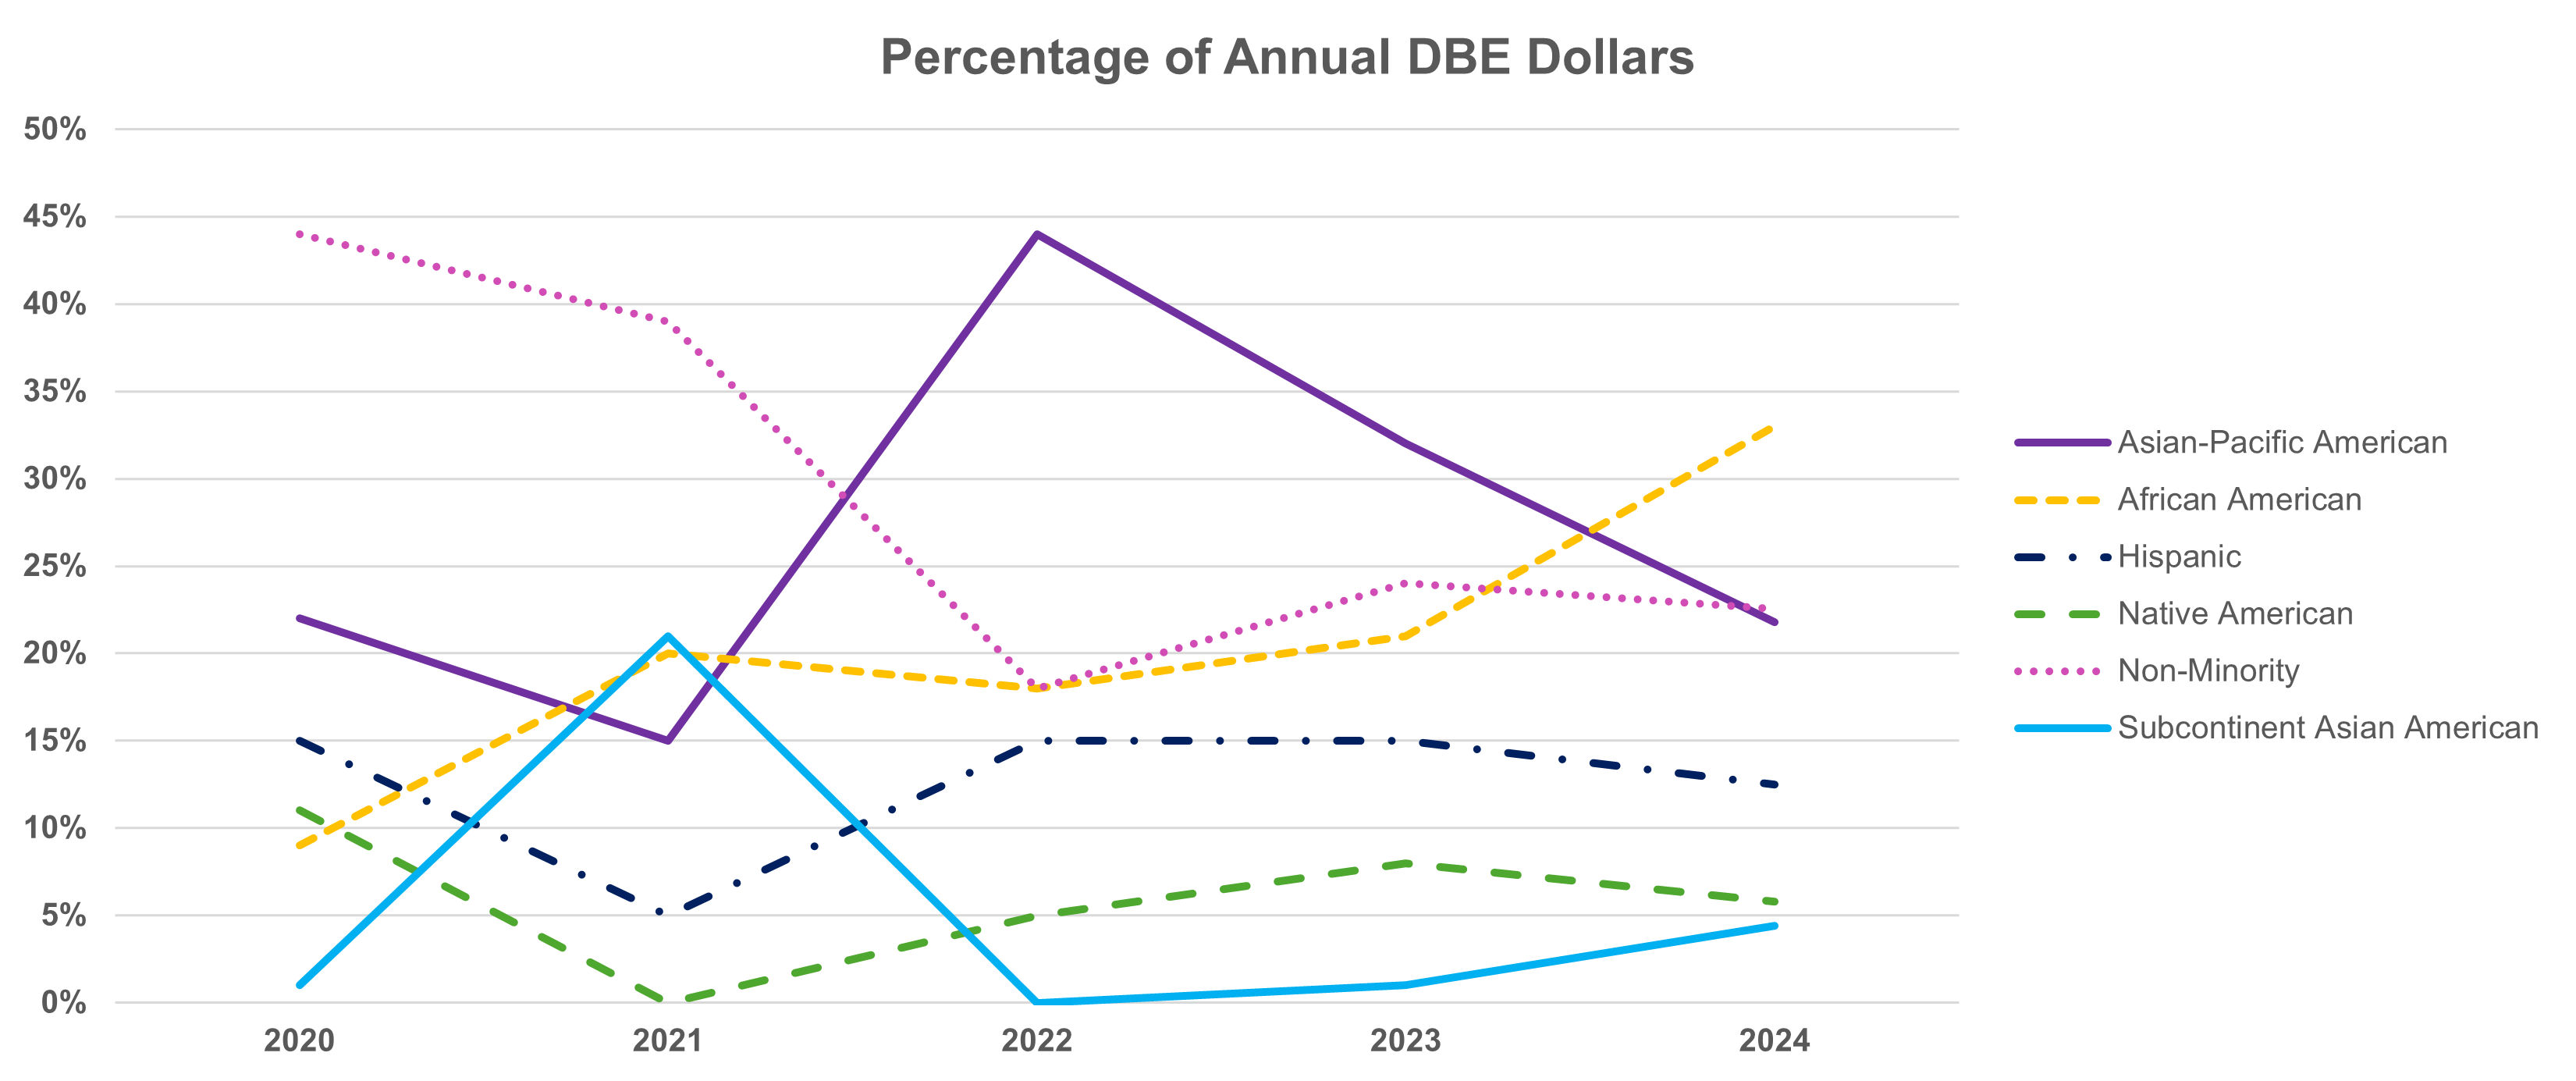
Percentage of annual DBE dollars
| FFY | Asian-Pacific American | African American | Hispanic | Native American | Non-Minority | Subcontinent Asian American |
| 2020 | 22% | 9% | 15% | 11% | 44% | 1% |
| 2021 | 15% | 20% | 5% | 0% | 39% | 21% |
| 2022 | 44% | 18% | 15% | 5% | 18% | 0% |
| 2023 | 32% | 21% | 15% | 8% | 24% | 1% |
| 2024 | 22% | 33% | 13% | 6% | 23% | 4% |